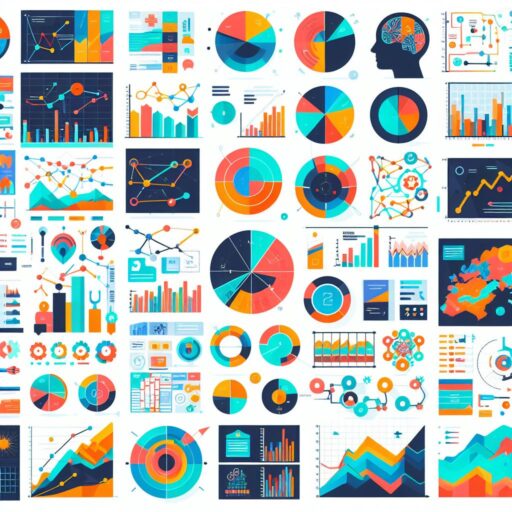
In the vast landscape of data, simplicity is the key to comprehension, and data visualization emerges as the linchpin in unlocking this simplicity. This article delves into the transformative world of data visualization techniques, exploring how these visualizations simplify complex data, making it accessible and actionable for decision-makers.
The Power of Visual Representation
The journey begins with the power of visual representation. Imagine a dynamic infographic vividly portraying the metamorphosis of raw data into vibrant visual insights. Visuals transcend the constraints of text, offering a clear understanding of intricate patterns within data. This not only simplifies information but also enhances comprehension and retention.
Interactive Dashboards
Enter the realm of interactive dashboards, where data comes alive at the fingertips of users. Visualize a user-friendly interface allowing individuals to interact with data dynamically. This interactive experience enables users to delve into specific details or zoom out for a broader perspective, simplifying the understanding of complex datasets.
Storytelling through Infographics
Infographics become the storytellers, weaving narratives within the data. Envision an infographic unfolding a captivating story, guiding readers through the complexities with ease. With strategic use of colors, icons, and concise text, infographics simplify complex concepts, making data accessible and engaging.
Heatmaps for Pattern Recognition
Heatmaps illuminate patterns within data through color intensity. Visualize a heatmap simplifying the complexity by highlighting areas of significance. Whether analyzing website user behavior or market trends, heatmaps simplify intricate data, enabling quick and informed decision-making.
Network Diagrams for Relationship Mapping
Network diagrams simplify the understanding of complex relationships. Picture a network diagram mapping intricate connections between data points. This technique is valuable for visualizing relationships in diverse fields, transforming intricate data into a comprehensible representation.
Time-Series Visualizations for Trends
Time-series visualizations unfold trends over time. Envision a chart simplifying the tracking of data changes, facilitating the recognition of patterns and fluctuations. This technique is instrumental in various industries, offering a streamlined approach to understanding temporal data dynamics.
Conclusion: Simplifying Complexity
In a data-driven world, simplicity is not just a virtue; it’s a necessity.
Visualize a before-and-after representation showcasing the intricate raw data and the streamlined, simplified version through data visualization techniques. As we embrace these powerful visualization tools, we embark on a journey where complex data is not a challenge but an opportunity for informed decision-making. The synergy of human cognition and innovative visualization techniques propels us towards a future where data is not just information but a transformative force.

